MakeUpMate
Machine Learning Project

Presentation File: PPT Link
Project Folder: Github Repository
Open these links to learn more about the project!
What was the goal of this project?
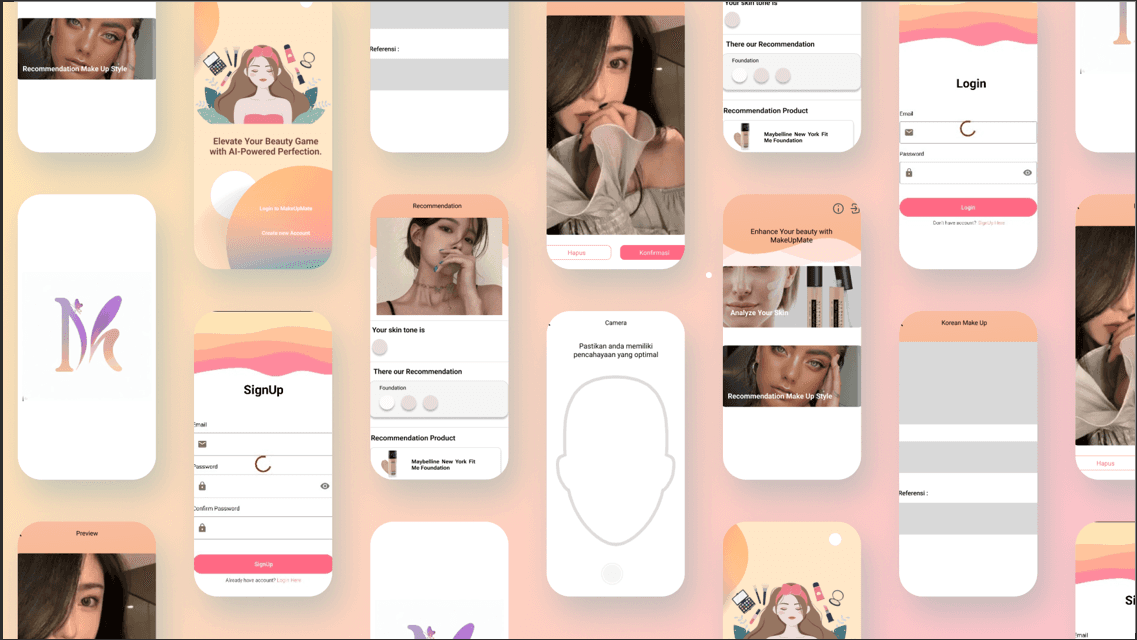
MakeUpMate is a Mobile cloud-based program that makes individualized suggestions for the best concealers, base products, and correctors to brighten your skin tone and conceal imperfections.
MakeUpMate utilize the power of machine learning and delivering it through mobile application so it’s accessible and enjoyable by everyone. With as easy as snap and scan, you will receive a prediction on what tone your skin color is and make recommendation on what make up is best for that skin color.
Tech Stack: TensorFlow, Python.
What did I do?
-Search and choose the best open dataset to work on for this project. Ended up using Google’s MST-E dataset (containing more than 1000 images).
-Enhance the dataset (adding 100+ images to each category) -using available online images to improve the existing MST-E dataset using scraper.
-Pre-process the data including adding, deleting, and editing the existing data to yield better result.
-Create and automation program to label image to each categories.
-Create and tune the architecture of a sequential CNN model from scratch.
-Hypertuning parameters to improve the existing model.
What did I achieve?
-Managed to create a Sequential CNN model with 0.83 validation accuracy
-The model able to classify skin color based on a facial image
-The model able to classify an image in less than 1 second
Resignment Intention
Complete Data and ML Project

Presentation File: ristek.link/Presentasi_RES
Project Folder: Github Repository
Open these links to learn more about the project!
What was the goal of this project?
In this project I was given a dataset from kaggle containing datas about employees and their intention to resign.
This dataset contains 1471 rows and 30 columns. Those columns consisted of information related to the worker and their intention to resign, such as: monthly_rate, performance, age, etc. Full explanation of the columns can be looked up here.
I was given a few question and was tasked to create some models covering regression, classification, and clustering to go with the project. Overall I was given quite a lot of freedom to explore the dataset and to make best of what the dataset can offer.
Tech Stack: Imblearn, Numpy, Pandas, Python, Scikit, Scipy.
What did I do?
-Created descriptive statistics to understand our dataset better
-Created visualization to help understand our dataset better
-Pre-processings
-Explored with a lot of features to gain insights (EDA)
-Tested various models for each regression, classification, and clustering to get the best outcome
What did I achieve?
-A total of eight insight regarding resignment was created including it’s visualization
-Able to create and determine the best classification model that can predict whether an employee will resign or not with 81% Accuracy and 73% recall
-Able to create and determine the best regression model that can predict how long until an employee will resign with 0.88 R-Squared
-Able to create a model that successfully clustered employees based on their characteristics and resignment intention
UTBK 2019
Data Analytics Exploration

What was the goal of this project?
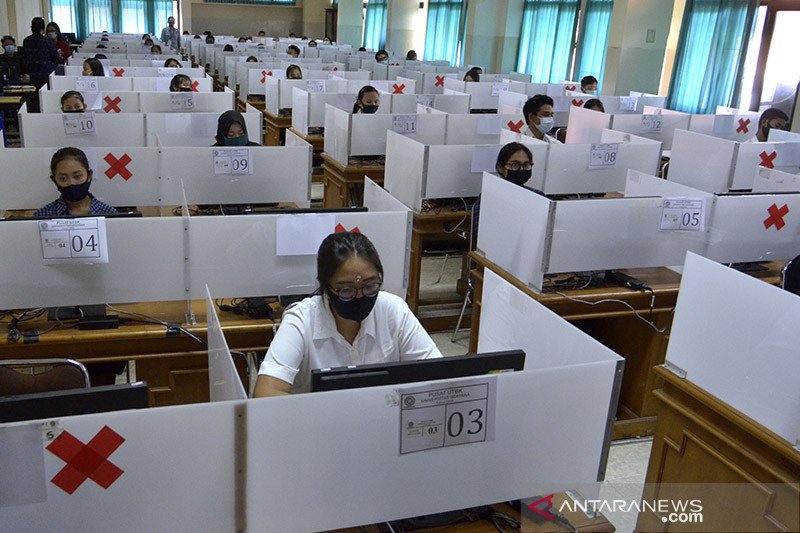
I wanted to explore about data and try out a public dataset that I can found on Kaggle. In the end, I found this UTBK 2019 dataset. I chose it because I was familiar with UTBK as I had one myself and wanting to know more insight about the topics
This project uses a combination of 4 different data that I combine for the purpose of this project. A combination total of 151.024 rows and 34 attributes on the data was used for this project. You can find the Kaggle dataset here.
What I was trying to do was actually started on a few question and freely move on from there to answer my own curiosity about this topics. In the end I was able to derrived a few interesting insight from this project.
Tech Stack: Numpy, Matplotlib, Pandas, Pylplot, Python, Seaborn
What did I do?
-Created descriptive statistics to understand the dataset better
-Created visualization to help understand the dataset better
-Pre-processing (data cleaning)
-Combined different data to make the dataset better
-Altered the data using lambda function to add and remove datas, attributes, etc
What did I achieve?
-Made a complete data that was a combination from 4 different data including UTBK(Science and Humanities) scores, university data, major data.
-A total of 5 insight regarding UTBK 2019 was able to be derrived
-Created 10 different visualization to help understand the insight better
Integrated Pest Management System
Web Full Stack


Project Folder: Private! Ask me about it!
Deployment Link: ipms.slickerius.com
Open these links to learn more about the project!
What was the goal of this project?
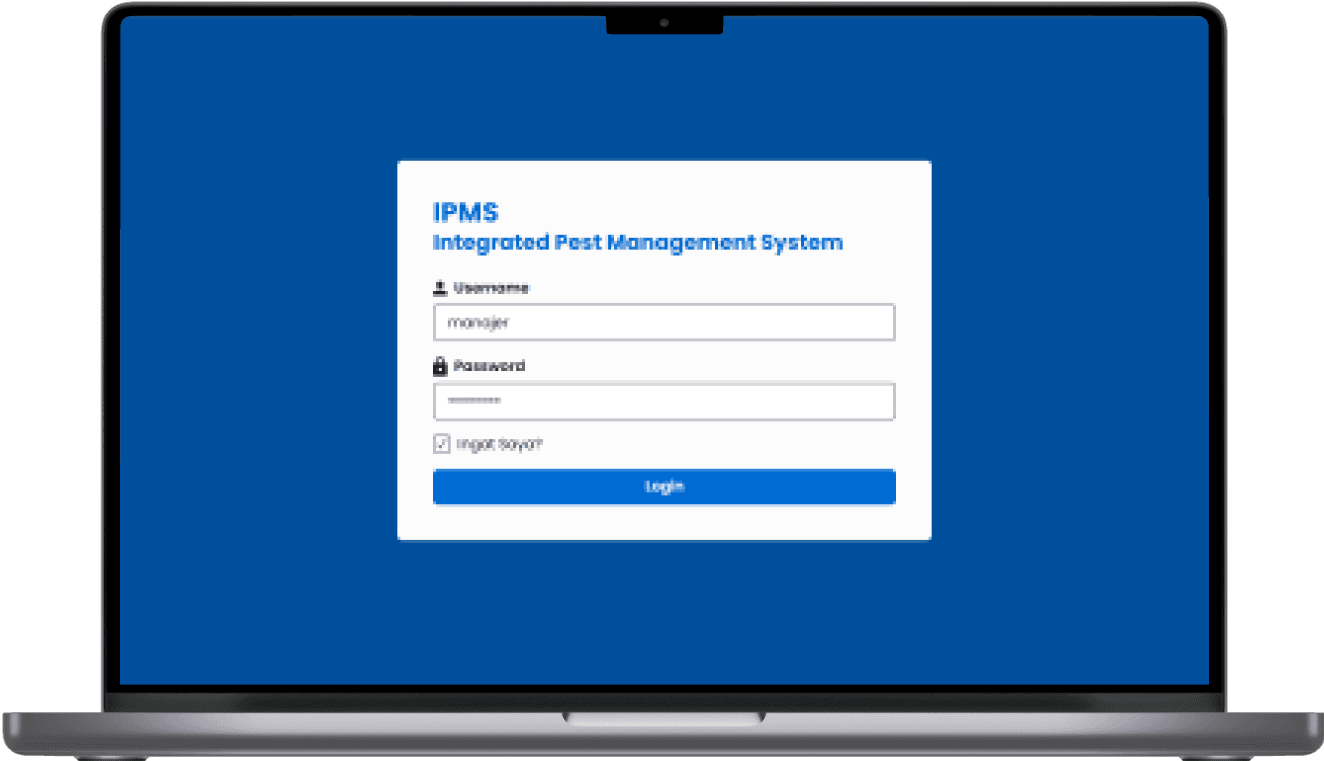
Integrated Pest Management System or in short IPMS is web-based information system that was made for internal purpose of our client, one of the biggest pest control company in Indonesia who sadly I cannot publicly mention. The goal of this project was to digitalize and centralize our client’s current business process.
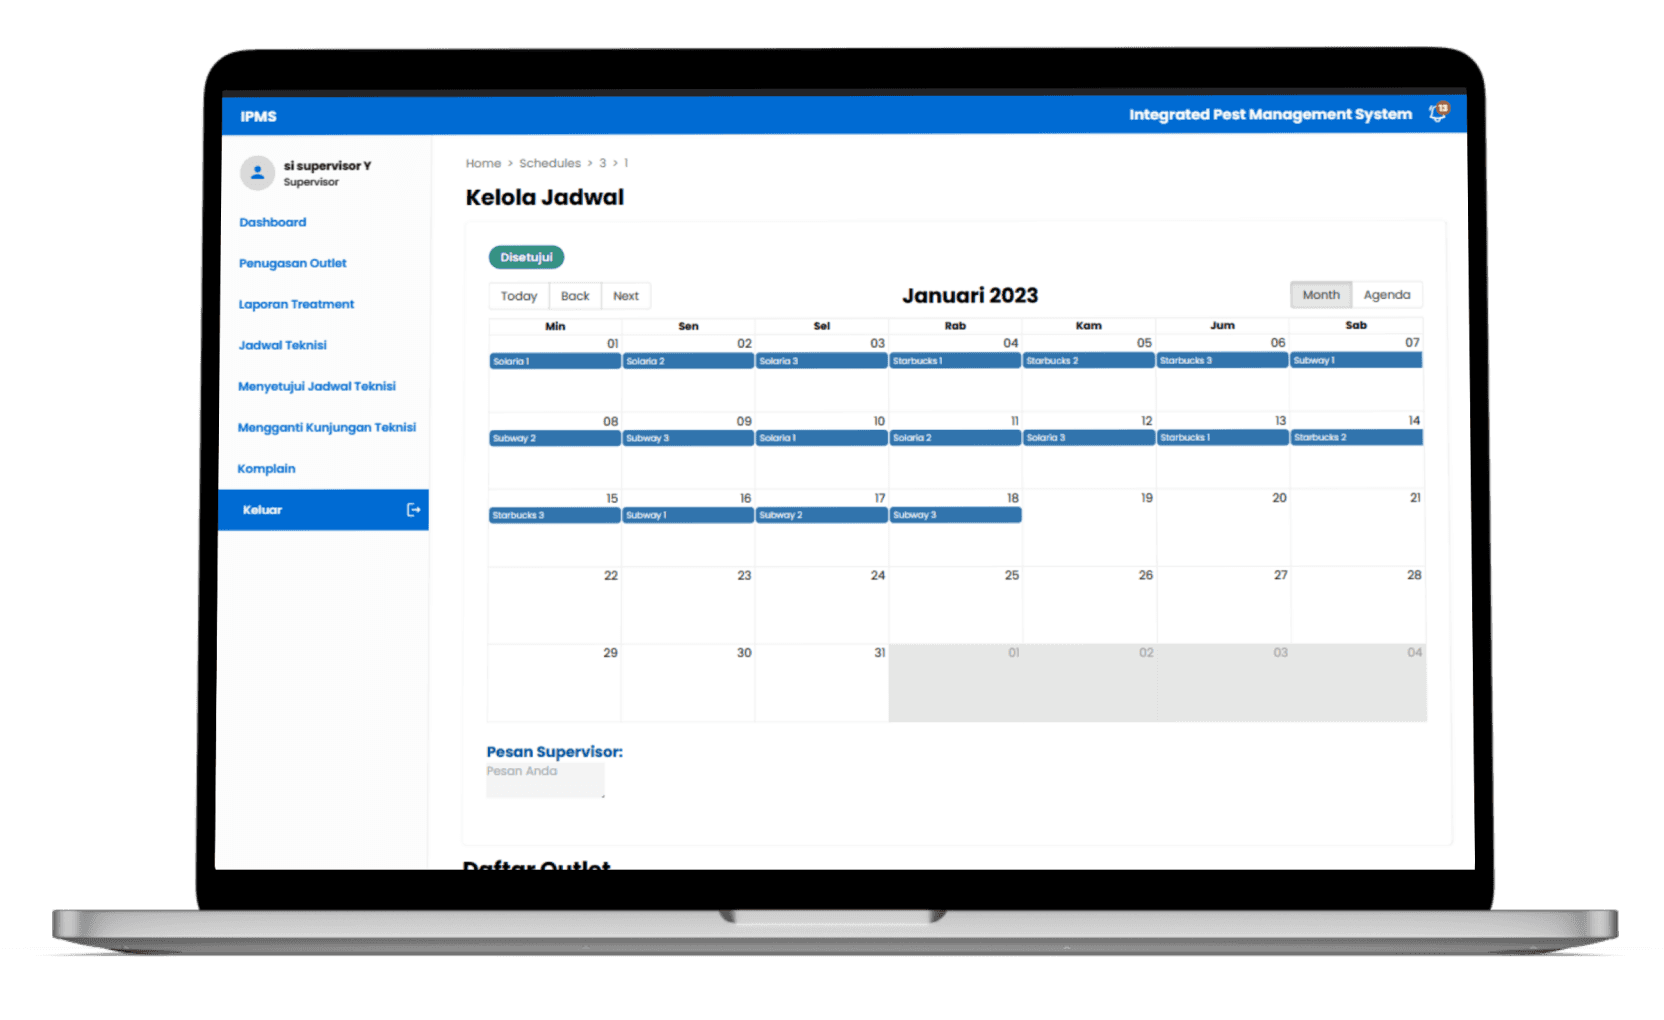
This information system have the capabilities to do item management, account management, schedule management, report form creation, report form exportation into PDFs, and made it all into a dashboard summary. I was responsible for the features related to report form creation and exportation.
Tech Stack: Java Springboot, MariaDB, Next.js, Tailwind CSS.
What did I do?
-At the start of the project, I was the Lead Designer.
-Created more than 200+ components.
-As a programmer I was responsible for report form features.
What did I achieve?
-Created models, controllers, and REST API Implementation in the backend using Java Springboot
-Implement my own design on frontend for report form features using Next.js and Tailwind CSS
-Implement form features including, form creation, for exportaition using JsPDF and React-PDF
-Able to implement breadcrumb feature (outside of form creation feature)